
From 21% to 4.9% surface-pressure error on AhmedML, for $15.54 of cloud GPU
A Frontier study that ingested all 500 AhmedML simulations, trained reference surrogates on rented GPUs, and certified them against a benchmark with calibrated drag intervals. Test pressure error fell from 0.213 to 0.049 relative L2.
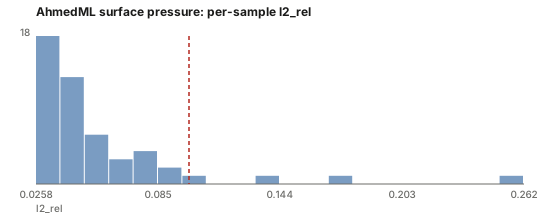
- test surface-pressure rel-L2 (was 0.213)
- 0.049
- surface-pressure R² on 50 test designs
- 0.996
- conformal Cd interval coverage (45/50)
- 90%
- total RunPod spend
- $15.54
The question
Most teams starting with physics AI have a few dozen simulations. They train a model, get a disappointing number, and cannot tell whether the cause is the architecture, the recipe or the amount of data. This study asked a narrower question. If the same pipeline is given the full public dataset, the right input features and a fixed training budget, does the surrogate reach published accuracy? And does the platform report honestly where it can and cannot be trusted?
The data
AhmedML, by Neil Ashton and collaborators (CC BY-SA 4.0): 500 OpenFOAM simulations of the Ahmed body, a standard automotive bluff-body benchmark, varied over 8 geometry parameters. Each native surface has about 2.2 million faces and carries the time-averaged pressure field pMean.
An earlier pass had used only 40 of these runs (31 for training), without surface normals. It reached an in-distribution surface-pressure relative L2 of 0.213 and a Cd error of 5.0%. Frontier's benchmark rated that "below acceptable".
What Frontier did
Ingest at scale, on rented hardware. A single frontier run ingest --on runpod command pulled all 500 runs onto a 140 GB volume on an RTX 4090 pod. It built four levels of detail per surface, ran the quality checks and wrote both split families. That took 44 minutes 47 seconds (18 minutes of it downloading 46 GB) and cost $0.69.
Train with one recipe for every model. Each model trained under the same setup: a random 400/50/50 split, the LOD-1 surfaces (about 100k faces each), 32,768 random faces per sample per step, and inputs of coordinates, surface normals and the 8 geometry parameters. Every model got 12,000 optimizer steps with bf16 autocast. Two networks were compared:
- Frontier's
transolver_lite(1.61 M parameters, 26 GPU-minutes); - NVIDIA PhysicsNeMo's
Transolver, run as shipped through Frontier's PhysicsNeMo bridge (1.67 M parameters, 31 GPU-minutes). Its weights were also saved as a native.mdluscheckpoint.
Evaluate on held-out designs at full resolution. frontier_eval evaluate scored the 50 test geometries against the ahmedml-surface-pressure benchmark (relative L2 at most 0.10 and R² at least 0.90) and the ahmedml-cd drag benchmark. A three-seed ensemble was also scored on every face of the native 2.2 M-face meshes.
Quantify uncertainty. frontier_eval uq calibrated conformal Cd intervals on the 50 validation designs. It fitted a Mahalanobis out-of-distribution screen on the 400 training geometries and produced a credibility report modelled on ASME V&V 40.
Results
| Run | Parameters | Test rel-L2 | Test R² | Test Cd error | Verdict |
|---|---|---|---|---|---|
| 40-run baseline (3-seed ensemble, validation) | 1.6 M × 3 | 0.213 | 0.94 | 5.0% | below acceptable |
| Transolver-lite, 400 cases | 1.61 M | 0.049 | 0.996 | 3.0% | strong |
| PhysicsNeMo Transolver, 400 cases | 1.67 M | 0.047 | 0.996 | 2.7% | strong |
| 3-seed ensemble, native 2.2 M-face mesh | 3 × 1.61 M | 0.057 | 0.994 | 3.4% | strong / Cd acceptable |
The two Transolver implementations agree to within seed noise, and both sit inside the 0.04–0.08 band reported for surface-pressure models on DrivAerML and AhmedML in the literature. Normals and data account for the improvement: the architecture is the same as in the 40-run pass, with a comparable budget per case.
Uncertainty, from the ensemble's credibility report:
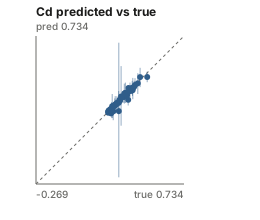
- Calibrated drag intervals. The 90% conformal Cd intervals covered 45 of the 50 test designs, exactly 90%. Their median width was 0.067.
- Out-of-distribution screening. 2 of the 50 test geometries were flagged as outside the training envelope.
- Per-point spread is a ranking signal only. Three-seed spread correlates with field error at 0.53, but only 54% of points fall inside the nominal 90% interval. The report therefore declined to qualify any individual case on per-point coverage.
Cost
All of this ran through frontier run on RunPod. The total was $15.54, counting the pods' real uptime at list price: $11.91 for the AhmedML pod (RTX 4090), $3.55 for a separate transient-flow pod (RTX 4080 SUPER) and $0.07 for a host that could not initialize CUDA.
Limits and caveats
- Not everything came back. Both pods were stopped while idle and could not be resumed on their hosts. The slant-angle extrapolation runs, the learning curves at N = 31/100/200 and a GeoTransolver retry stayed on the stopped volume, and they are not reported. The planner's learning-curve exponent (about 0.70) is marked provisional because it rests on two points.
- GeoTransolver did not finish in this campaign. The slim trainer image lacked a C compiler that Triton needs. The image now includes one; the model trains and round-trips on CPU in tests.
- Interpolation, not extrapolation. These are random-split results. The earlier 40-run study showed that a slant-angle hold-out is much harder (0.362 relative L2), and Frontier's OOD screen flagged all six of those designs.
- The ensemble mean scores worse than its best member on the native mesh (0.057 against 0.049). It is scored on all 2.2 M faces, including the seam regions LOD-1 training never saw. The value of the ensemble is its spread, not its mean.
Dataset credit: AhmedML, Neil Ashton and collaborators, CC BY-SA 4.0.
Try it on your data
Do you have a few hundred simulations of your own product family? Join the waitlist or talk to us about training and certifying a surrogate on them.