
Evaluating NVIDIA's pretrained GeoTransolver on all 48 held-out DrivAerML cars
A Frontier study that ran NVIDIA's published GeoTransolver checkpoint against every held-out DrivAerML design, with hashes for the model, data and split, for about $13 of cloud GPU time. Drag R² 0.995, mean drag error 0.84%.
- held-out car designs evaluated
- 48 / 48
- drag force R²
- 0.995
- mean relative drag error
- 0.84%
- single H100 pod, end to end
- 3.3 h
The question
Pretrained physics models are now published with open weights. NVIDIA released a GeoTransolver checkpoint trained on DrivAerML, a dataset of 500 parametric car designs simulated with scale-resolving CFD. Before an engineering team builds on a checkpoint like this, they need to know three things. How accurate is it on designs it never saw? Can the result be reproduced exactly? And can an engineer look at where it is wrong?
This study used Frontier to answer those questions for the published checkpoint. We did not train the model. The work was to run it and score it carefully.
The data
- Dataset: DrivAerML, by Neil Ashton and collaborators (arXiv:2408.11969), licensed CC BY-SA 4.0. Full-resolution vehicle surfaces carry pressure and wall-shear fields.
- Model: NVIDIA's pretrained GeoTransolver for DrivAerML (
nvidia/geotransolver_drivaerml, NVIDIA Open Model License). According to NVIDIA's model card it was trained on 436 cases, with 48 held out. - Evaluation: all 48 held-out cases, scored with NVIDIA's PhysicsNeMo-CFD benchmark code pinned to one commit.
What Frontier did
Pinned every input. The run records the checkpoint revision and SHA-256, the normalization statistics hash, the dataset revision, the benchmark commit and the SHA-256 of the split file. When the two evaluation cohorts were merged, the summary step checked that all of these matched. It also rejected any missing or overlapping case IDs.
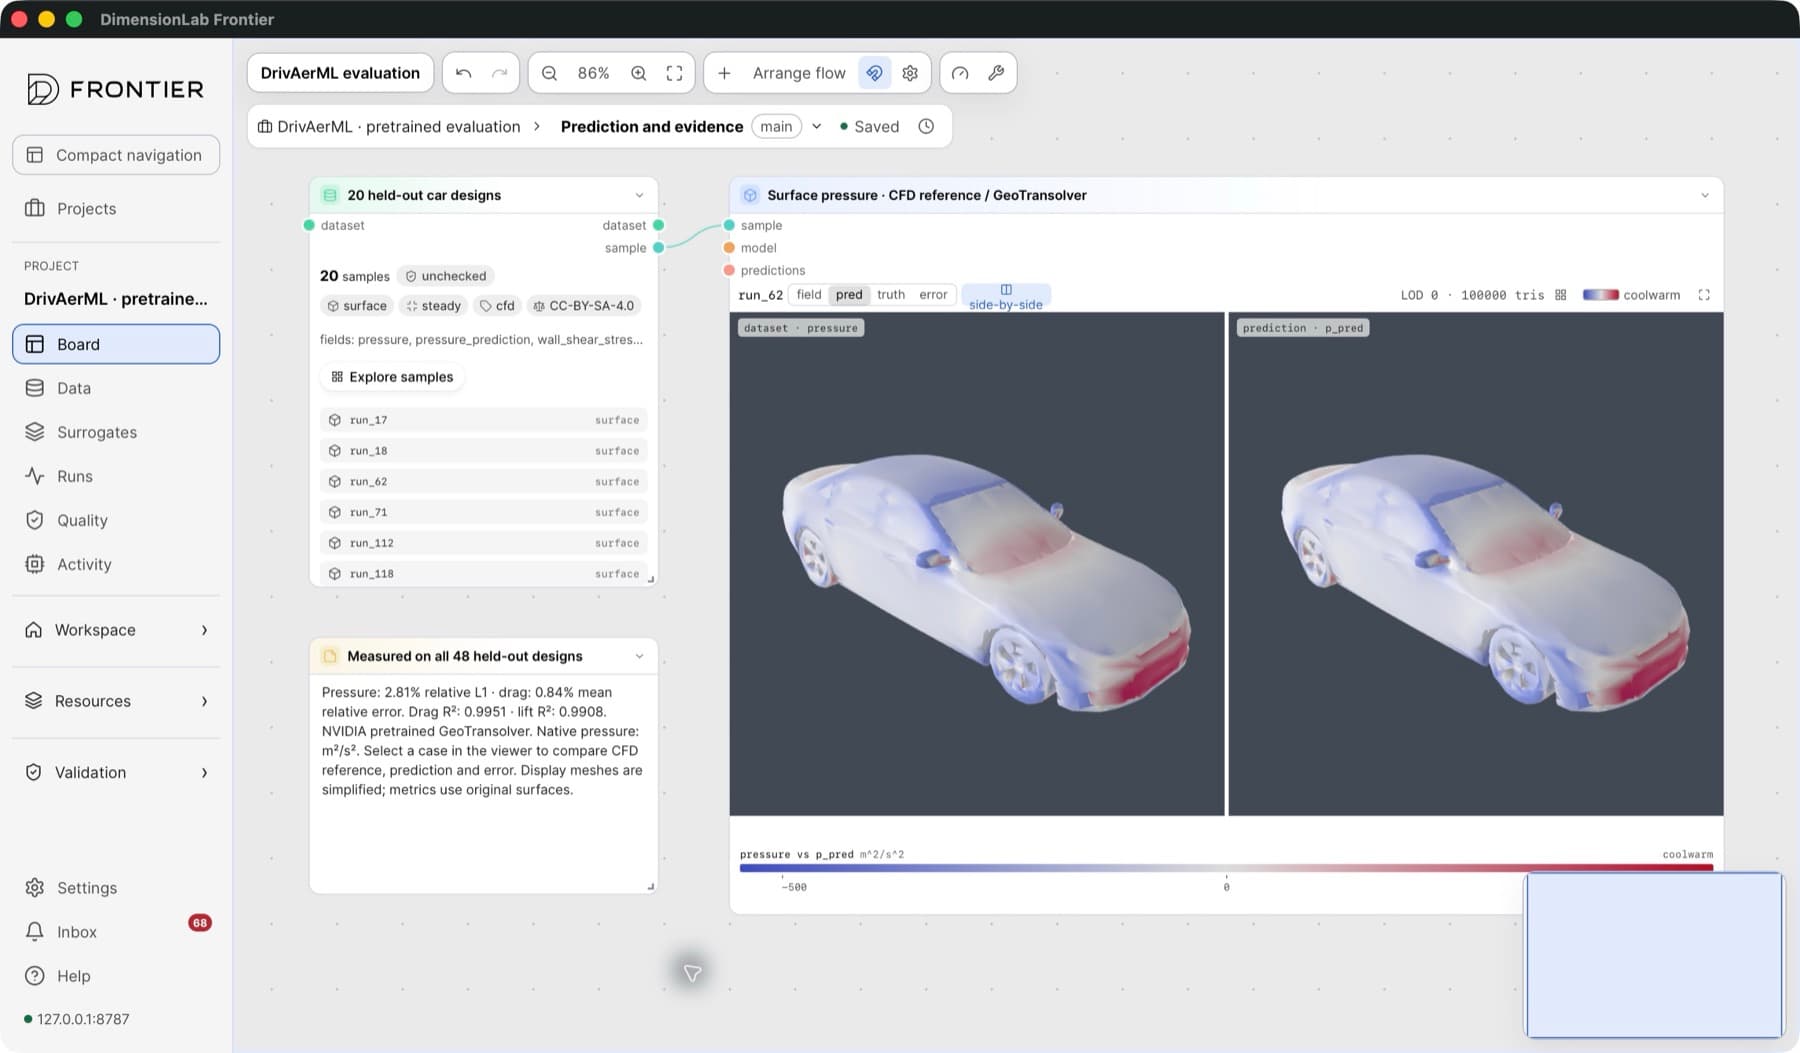
Fixed the showcase subset before looking at results. Twenty of the 48 cases were chosen for full visual export. They were picked at evenly spaced ranks of reference drag, taken from the benchmark's validation file, before any prediction was inspected. That removes the temptation to show only the best cars.
Checked the weights, then ran on GPU only. A CPU preflight compared every loaded tensor against the checkpoint. Inference then ran on a single NVIDIA H100 80 GB in a RunPod pod. The evaluation script never falls back to CPU silently.
Ran it in stages. A two-case pilot covered the lowest- and highest-drag designs. The fixed 20-case cohort followed, then the remaining 28 cases without heavy visual exports. The successful pod ran for 3.33 hours. That is about $13.30 of GPU time, plus $0.52 for an earlier failed pod and storage. These figures are elapsed-time estimates, not an invoice. Every export checksum was verified before the pod was terminated.
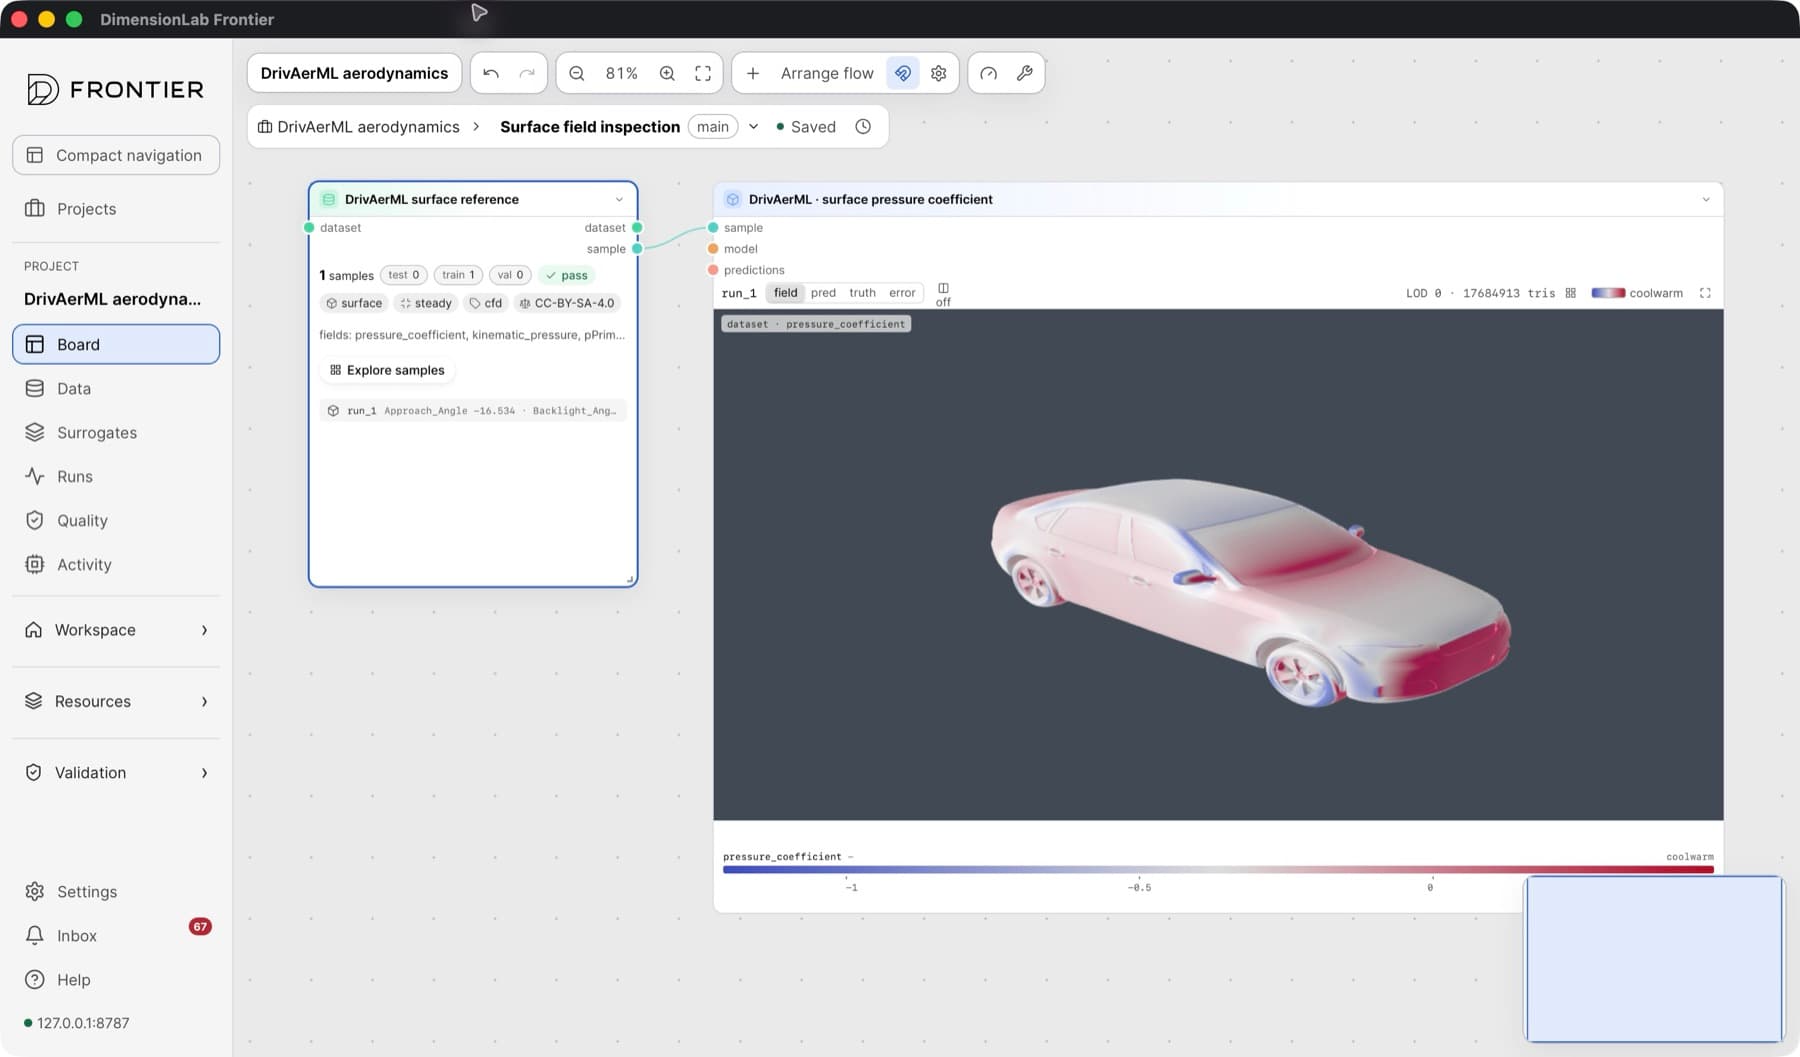
Made the results inspectable. The 20 comparison cases became a portable 89 MB inspection archive with 100k, 20k and 5k-face display meshes and Arrow prediction files. In the Frontier app, each car opens on a board with the CFD reference, the prediction and the error side by side. Full-resolution reference surfaces are also large. The one below has 17.7 million triangles, and it opens in the same viewer.
Results
Means over all 48 held-out designs:
| Metric | Measured in Frontier |
|---|---|
| Surface pressure, relative L1 error | 2.81% |
| Wall shear stress, relative L1 error | 6.73% |
| Mean relative drag error | 0.84% |
| Drag force R² (48 pairs) | 0.995 |
| Lift force R² (48 pairs) | 0.991 |
| Mean relative lift error | 27.7% |
- pressure relative L1
- 2.81%
- wall shear relative L1
- 6.73%
- lift force R²
- 0.991
- inspection archive, 20 cars
- 89 MB
The fixed 20-case cohort on its own gave 2.80% pressure error, 0.91% drag error and a drag R² of 0.9947. That is consistent with the full set, so the showcase cars are not a flattering sample.
What it shows, and the caveats
Pressure and integrated drag are close to what NVIDIA reports for this model. For an engineer screening designs on drag, a 0.84% mean error with R² 0.995 across 48 unseen cars is a useful result.
Several numbers need to be read with care, and the study records them alongside the headline:
- Wall shear is worse than published. We measured 6.73% relative L1. The paper reports 4.90%. We have not established whether this comes from a protocol difference or from something else, so this is a complete evaluation of the checkpoint, not a reproduction of the paper.
- Relative lift error looks large because lift is near zero. Several cars have reference lift close to zero, which inflates relative error to 27.7% even though lift R² is 0.991. Both numbers are kept, and neither stands in for the other.
- Relative L1 and L2 are different metrics. They are reported separately and should not be swapped when comparing against literature.
- No training is claimed. NVIDIA's training configuration (436 cases, up to 500 epochs, a GB200 node) is stored as publisher metadata, apart from the measured evaluation. A separate kernel probe timed one 60,000-query forward and backward pass at 0.58 s, using 54 GB on the H100. Extrapolated, that is a lower bound of about $140 for a full 500-epoch fine-tune. It is not a budget, because it leaves out data loading, optimizer steps, validation and checkpointing.
Dataset credit: DrivAerML, Neil Ashton and collaborators, CC BY-SA 4.0 (https://huggingface.co/datasets/neashton/drivaerml). Display meshes are decimated, with fields interpolated from the originals. Native pressure and wall shear are density-normalized (m²/s²). Model: NVIDIA GeoTransolver, NVIDIA Open Model License.
Try it on your data
Do you have a pretrained model or an in-house surrogate you need to check against your own held-out designs? Join the waitlist or talk to us.